
Navigating Uncertainty: A Road Map After College Graduation
Graduation brings uncertainty, but also opportunity. Explore practical guidance for making thoughtful choices and building a meaningful path forward.

Many people start out managing their own investments. But as their earnings and assets grow, their financial needs and challenges become more complex. And continuing to go it alone could prove costly in terms of investing miscues. Consider three common mistakes that can reduce returns and increase anxiety.
Investors may be tempted to cash out of the stock market to avoid a predicted downturn. But accurately forecasting the market’s direction to time when to buy and sell is a guessing game. Missing only a brief period of strong market performance can drastically affect your lifetime wealth.
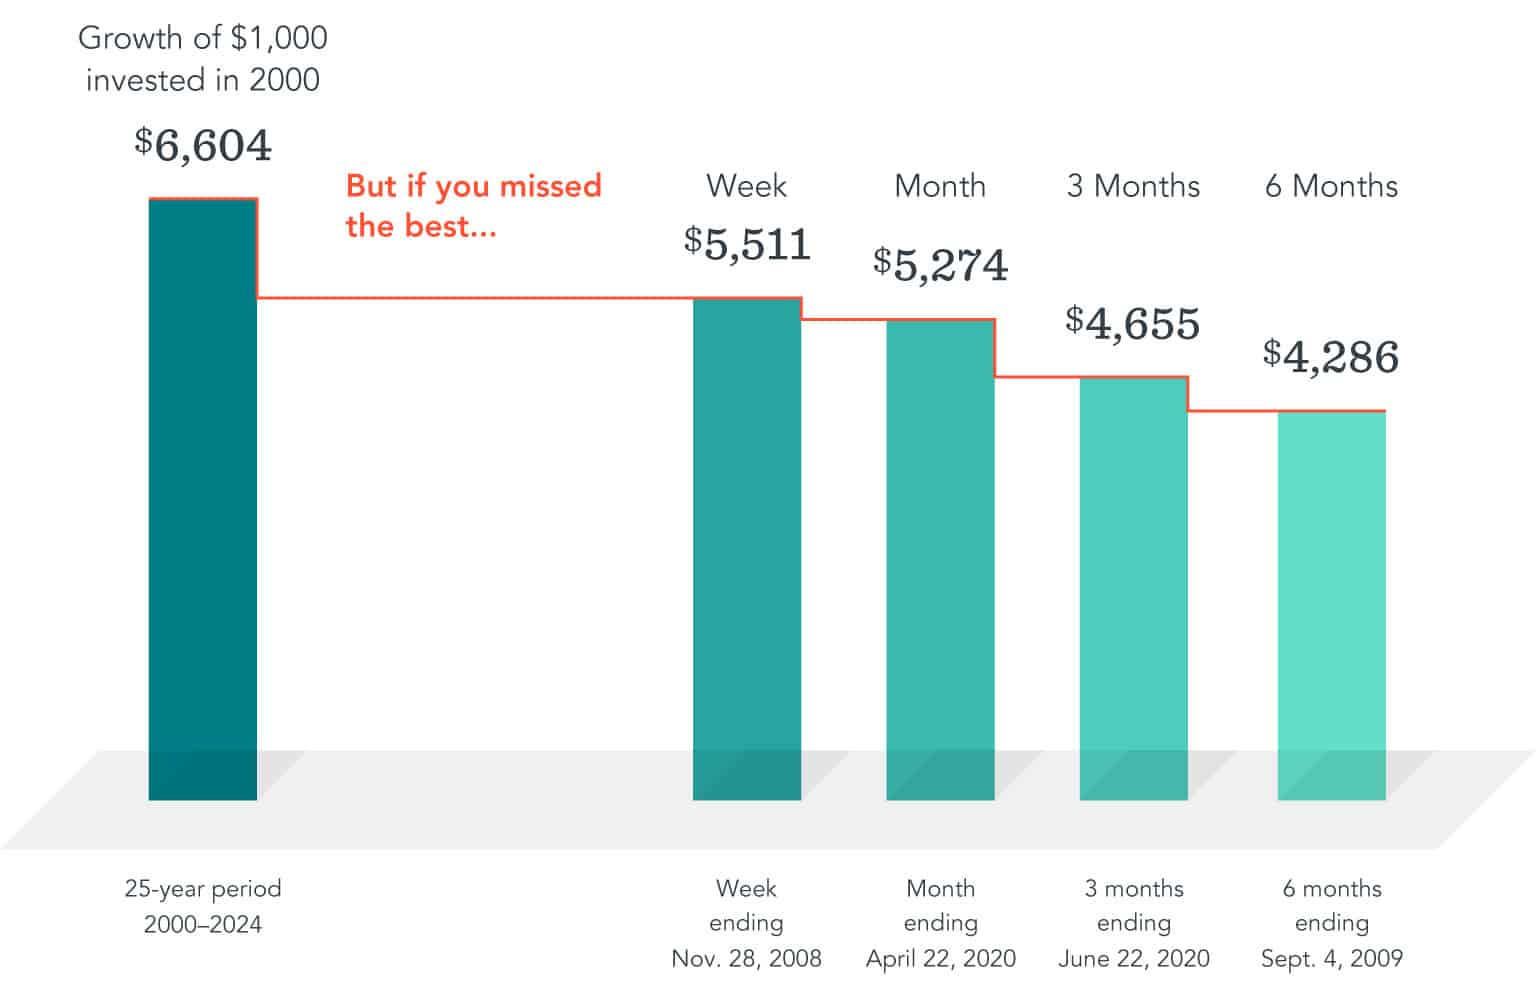
For example, the chart below shows a hypothetical investment in the Russell 3000 Index, a broad US stock market benchmark. Over the entire 25-year period ending December 31, 2024, a $1,000 investment in 2000 turned into $6,604. But what if you pulled your cash out at the wrong time? Missing the best week, month, three months or six months would have significantly reduced the growth of your investment.
Russell 3000 Index Total Return (2000–2024)
Rather than trying to predict when stocks will rise and fall, investors can hold a globally diversified portfolio. And by staying invested, be better positioned to capture returns whenever and wherever they occur.
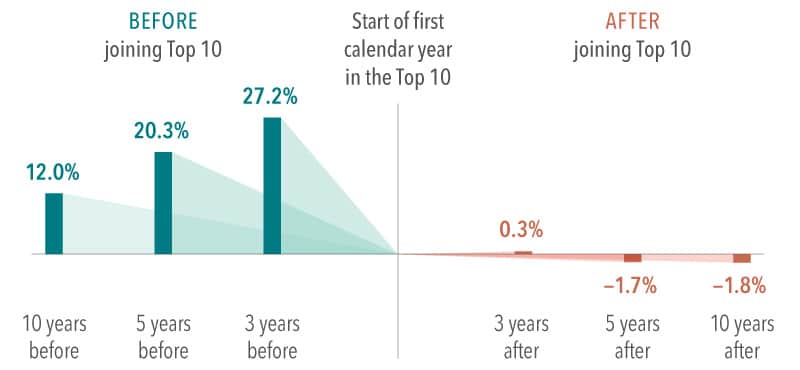
Investors may become enamored with popular stocks based on recent performance or media attention, and overconcentrate their portfolio holdings in these companies. One example is the rise of the large US technology companies known as the Magnificent 7 (Alphabet, Amazon, Apple, Meta Platforms, Microsoft, NVIDIA and Tesla). But the chart below shows that many fast-growing stocks have stopped outperforming after becoming one of the 10 largest stocks in the US. On average, companies that outperformed the market on the way up failed to outperform in the years after making the Top 10 list.
Average Annualized Outperformance of Companies Before and After the Year They Became One of the 10 Largest in the US (1927–2024)
The lesson? Rather than loading up on a handful of stocks that have dominated the market, you can own many stocks through mutual funds or ETFs. Diversifying across industries and global markets can help reduce overall risk and position investors to potentially capture the returns of future top-performing companies.
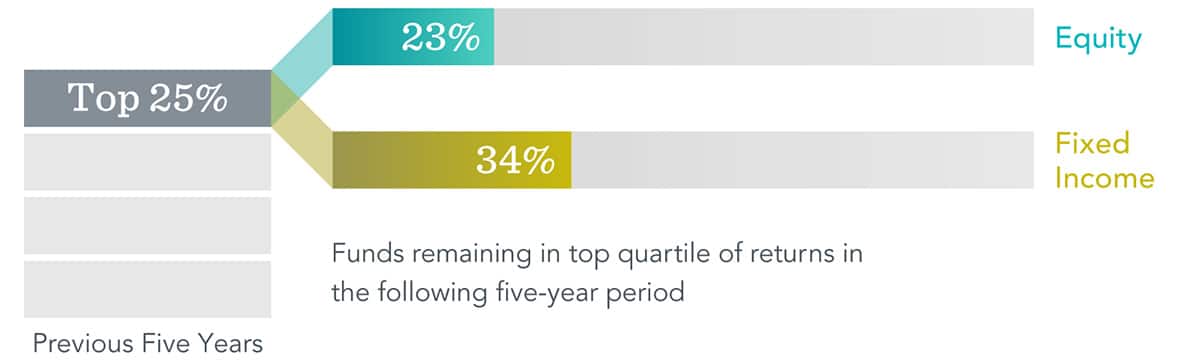
You might be inclined to select investments based on past returns, expecting top-ranked funds to continue delivering the best performance. But can they maintain that outperformance? Research shows that most funds ranked in the top 25% based on five-year returns did not remain in the top 25% in the next five years. In fact, only about one in five equity funds stayed in the top-performing group, and only about a third of fixed income funds did. The lesson? A fund’s past performance offers limited insight into its future returns.
Avoiding these mistakes can improve the odds of reaching your long-term investment goals. But, as a do-it-yourself investor, you will have to manage the challenge alone. A qualified financial advisor can offer deeper expertise and insights that lead to better financial habits.
But the potential benefits go beyond just helping you avoid a bad decision. An advisor can design a diversified, research-backed investment strategy based on your long-term goals and comfort level with risk. Equally important, you can look to a seasoned professional for guidance through different markets. By walking with you on the journey, an advisor can encourage the discipline essential to building wealth over time.
Past performance is no guarantee of future results. Indices are not available for direct investment. Their performance does not reflect the expenses associated with the management of an actual portfolio.
Russell 3000 Index Total Return (2000–2024) Chart: In USD. For illustrative purposes. For the purposes of this analysis, we assume the following number of trading days for each period: five trading days in a week, 21 trading days in a month, 63 trading days in three months, and 126 trading days in six months. Best performance dates represent end of period (November 28, 2008, for best week; April 22, 2020, for best month; June 22, 2020, for best three months; and September 4, 2009, for best six months). The missed best consecutive days examples assume that the hypothetical portfolio fully divested its holdings at the end of the day before the missed best consecutive days, held cash for the missed best consecutive days, and reinvested the entire portfolio in the Russell 3000 Index at the end of the missed best consecutive days. Data presented in the Growth of $1,000 exhibit is hypothetical and assumes reinvestment of income and no transaction costs or taxes. The data is for illustrative purposes only and is not indicative of any investment. Frank Russell Company is the source and owner of the trademarks, service marks, and copyrights related to the Russell Indexes.
Stocks on the Way Up, and After Chart: As compared to the S&P 500 Index. In USD. Source: Dimensional, using data from CRSP. Includes all US common stocks excluding REITs. Largest stocks identified at the end of each calendar year by sorting eligible US stocks on market capitalization. Ten largest companies by market capitalization. Returns after joining the 10 largest are measured as of the start of the first calendar year after a stock joins the Top 10. Annualized excess return is the difference in annualized compound returns between the stock and the S&P 500 Index over the three-, five-, and 10-year periods, before and after each stock’s initial year-end classification in the Top 10. Three-, five-, and 10-year annualized returns are computed for companies with return data available for the entire three-, five-, and 10-year periods, respectively. The number of firms included in measuring excess returns prior (subsequent) to becoming a Top 10 stock consists of 44 (58) for the three-year period, 43 (55) for the five-year period, and 34 (49) for the 10-year period. S&P data © 2025, S&P Dow Jones Indices LLC, a division of S&P Global. All rights reserved.
This article was written and first posted by Dimensional Fund Advisors.
DISCLOSURES
The information in this material is intended for the recipient’s background information and use only. It is provided in good faith and without any warranty or representation as to accuracy or completeness. Information and opinions presented in this material have been obtained or derived from sources believed by Dimensional to be reliable, and Dimensional has reasonable grounds to believe that all factual information herein is true as at the date of this material. It does not constitute investment advice, a recommendation, or an offer of any services or products for sale and is not intended to provide a sufficient basis on which to make an investment decision. Before acting on any information in this document, you should consider whether it is appropriate for your particular circumstances and, if appropriate, seek professional advice. It is the responsibility of any persons wishing to make a purchase to inform themselves of and observe all applicable laws and regulations. Unauthorized reproduction or transmission of this material is strictly prohibited. Dimensional accepts no responsibility for loss arising from the use of the information contained herein.
This material is not directed at any person in any jurisdiction where the availability of this material is prohibited or would subject Dimensional or its products or services to any registration, licensing, or other such legal requirements within the jurisdiction.
“Dimensional” refers to the Dimensional separate but affiliated entities generally, rather than to one particular entity. These entities are Dimensional Fund Advisors LP, Dimensional Fund Advisors Ltd., Dimensional Ireland Limited, DFA Australia Limited, Dimensional Fund Advisors Canada ULC, Dimensional Fund Advisors Pte. Ltd., Dimensional Japan Ltd., and Dimensional Hong Kong Limited. Dimensional Hong Kong Limited is licensed by the Securities and Futures Commission to conduct Type 1 (dealing in securities) regulated activities only and does not provide asset management services.
RISKS
Investments involve risks. The investment return and principal value of an investment may fluctuate so that an investor’s shares, when redeemed, may be worth more or less than their original value. Past performance is not a guarantee of future results. There is no guarantee strategies will be successful.
DISCLAIMER
Shore Point Advisors is an investment adviser located in Brielle, New Jersey. Shore Point Advisors is registered with the Securities and Exchange Commission (SEC). Registration of an investment adviser does not imply any specific level of skill or training and does not constitute an endorsement of the firm by the Commission. Shore Point Advisors only transacts business in states in which it is properly registered or is excluded or exempted from registration. Insurance products and services are offered through JCL Financial, LLC (“JCL”). Shore Point Advisors and JCL are affiliated entities.
Graduation brings uncertainty, but also opportunity. Explore practical guidance for making thoughtful choices and building a meaningful path forward.

Prepare for Medicare by understanding enrollment deadlines, coverage options, and key planning considerations for retirement healthcare.

Learn how portfolio rebalancing can help investors stay aligned with their goals, manage risk, and avoid emotional decisions.

Shore Point Advisors has announced the addition of Nick Lanier as a Wealth Advisor, joining the firm as its newest team member.