Finding Your Fiduciary Financial Advisor
When you are selecting or retaining a financial advisor, how do you know if you are making the best choice?

Election years can be fraught with uncertainty as developments surrounding the candidates, their platforms, and their predicted effects on the economy and markets dominate the news. But should you let this stream of political information influence how you manage your investment portfolio?
A lengthy history of empirical research suggests not.
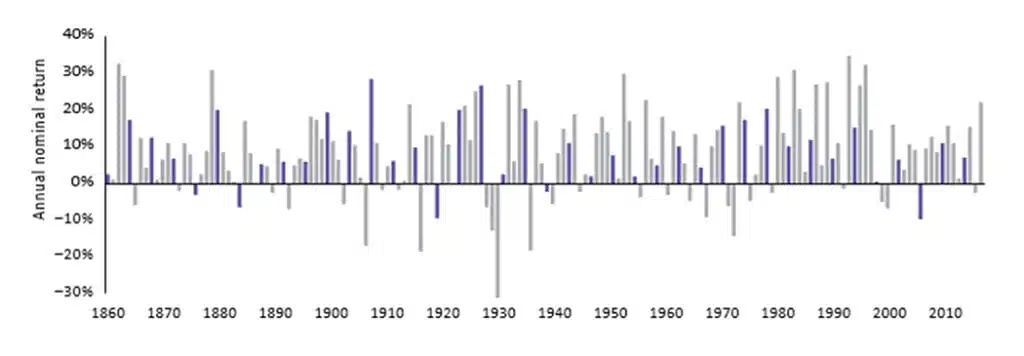
Elections matter, just not in all the ways you might think to an investor. Of course, they hold great importance in upholding the U.S. tradition of democratic, representative government. However, their impact on market returns has historically proven to be negligible, as shown in the chart below.
Comparing election years versus nonelection years: 60% stock /40% bond portfolio returns show no significant statistical difference

8.9% – Average return during election years (40 periods)
8.1% – Average return during nonelection years (120 periods)
Source: Vanguard calculations, based on data from Global Financial Data as of December 31, 2019. Data represents the 60% GFD US-100 Index and 40% GFD US Bond Index, as calculated by historical data provider Global Financial Data. The GFD US-100 Index includes the top 25 companies from 1825 to 1850, the top 50 companies from 1850 to 1900, and the top 100 companies by capitalization from 1900 to the present. In January of each year, the largest companies in the United States are ranked by capitalization, and the largest companies are chosen to be part of the index for that year. The next year, a new list is created and it is chain-linked to the previous year’s index. The index is capitalization-weighted, and both price and return indices are calculated. The GFD US Bond Index uses the U.S. government bond closest to a 10-year maturity without exceeding 10 years from 1786 until 1941 and the Federal Reserve’s 10-year constant maturity yield beginning in 1941. Each month, changes in the price of the underlying bond are calculated to determine any capital gain or loss. The index assumes a laddered portfolio that pays interest on a monthly basis. All returns assume dividends/interest coupons are reinvested into their respective indexes. Average returns are geometric mean.
Note: Past performance is no guarantee of future returns. The performance of an index is not an exact representation of any particular investment, as you cannot invest directly in an index.
Given the horse-race nature of political campaigns, you may think that in the months closest to an election, there is a noticeable uptick in volatility. Think again. In actuality, the opposite has been true. From January 1, 1964, to December 31, 2019, the Standard & Poor’s 500 Index’s annualized volatility was 13.8% in the 100 days both before and after a presidential election, which was lower than the 15.7% annualized volatility for the full time period.
S&P 500 Index Annualized Volatility
Full Time Period: 15.7%

Source: Vanguard calculations of S&P 500 Index daily return volatility from January 1, 1964, through December 31, 2019, based on data from Thomson Reuters.
Note: Past performance is no guarantee of future returns. The performance of an index is not an exact representation of any particular investment, as you cannot invest directly in an index.
The bottom line: Elections are another one of those events that generate lots of headlines but that should not sway you from following the financial plan we created. It’s understandable to have concerns about the election. But as far as your portfolio and the markets are concerned, history suggests it will be a nonissue.
Part of successful investing is understanding what you can control, and letting your emotions take a backseat to the financial plan we put in place. By maintaining perspective, discipline, and a long-term outlook, you can sustain progress toward your financial goals, despite the short-run uncertainty that events such as elections can create.

This post was prepared and first distributed by Vanguard.
Notes:
All investing is subject to risk, including possible loss of principal. Be aware that fluctuations in the financial markets and other factors may cause declines in the value of your account. There is no guarantee that any particular asset allocation or mix of funds will meet your investment objectives or provide you with a given level of income.
Diversification does not ensure a profit or protect against a loss.
Investments in bonds are subject to interest rate, credit, and inflation risk.
Shore Point Advisors is registered as an investment adviser with the State of New Jersey. Shore Point Advisors only transacts business in states where it is properly registered, or is excluded or exempted from registration requirements. Past performance is not indicative of future returns. All investment strategies have the potential for profit or loss. There are no assurances that an investor’s portfolio will match or outperform any particular benchmark. Content was prepared by a third-party provider. All information is based on sources deemed reliable, but no warranty or guarantee is made as to its accuracy or completeness. All expressions of opinion reflect the judgment of the authors on the date of publication and are subject to change.

When you are selecting or retaining a financial advisor, how do you know if you are making the best choice?

Equity compensation can provide a big financial boost, but it is important to manage it by balancing potential risks and rewards.

In the second part of this young investor series, we discuss three more investment concepts every young investor may want to embrace.

If you are new to investing, it can be tough to know where to get started. There is so much information and advice out there.