Finding Your Fiduciary Financial Advisor
When you are selecting or retaining a financial advisor, how do you know if you are making the best choice?

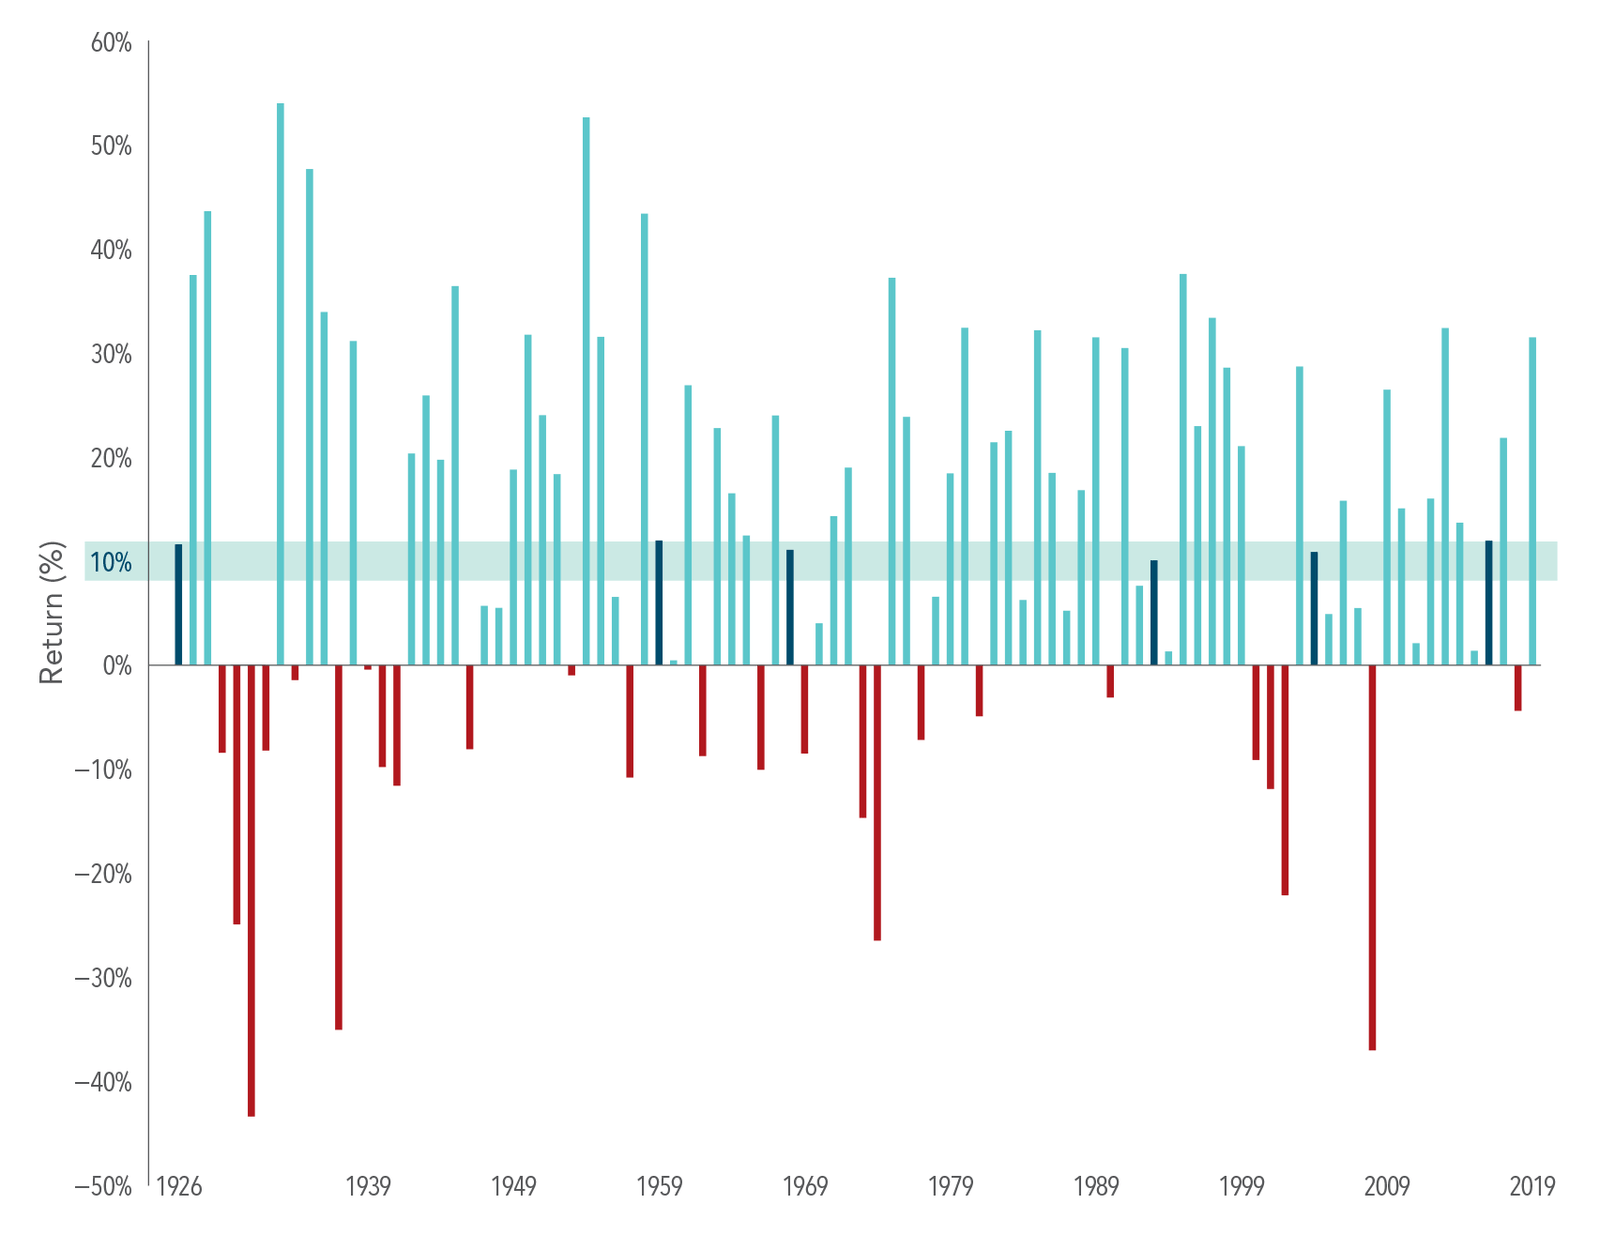
S&P 500 Index – Annual Returns (1926-2019)

Since 1926, the US stock market has rewarded investors with an average annual return of about 10%. But it is important to remember that returns in any given year may be sky-high, extremely poor, or somewhere in between.
Understanding the range of potential outcomes can help you stick with a plan and ride out the inevitable ups and downs.

This post was prepared and first distributed by Dimensional Fund Advisors.
Shore Point Advisors is registered as an investment adviser with the State of New Jersey. Shore Point Advisors only transacts business in states where it is properly registered, or is excluded or exempted from registration requirements. Past performance is not indicative of future returns. All investment strategies have the potential for profit or loss. There are no assurances that an investor’s portfolio will match or outperform any particular benchmark. Content was prepared by a third-party provider. All information is based on sources deemed reliable, but no warranty or guarantee is made as to its accuracy or completeness. All expressions of opinion reflect the judgment of the authors on the date of publication and are subject to change.

When you are selecting or retaining a financial advisor, how do you know if you are making the best choice?

Equity compensation can provide a big financial boost, but it is important to manage it by balancing potential risks and rewards.

In the second part of this young investor series, we discuss three more investment concepts every young investor may want to embrace.

If you are new to investing, it can be tough to know where to get started. There is so much information and advice out there.