10 Ways Every Entrepreneur Can Adopt an Investing Mindset
Discover an investing mindset every entrepreneur can use to build wealth, manage risk and grow with confidence.


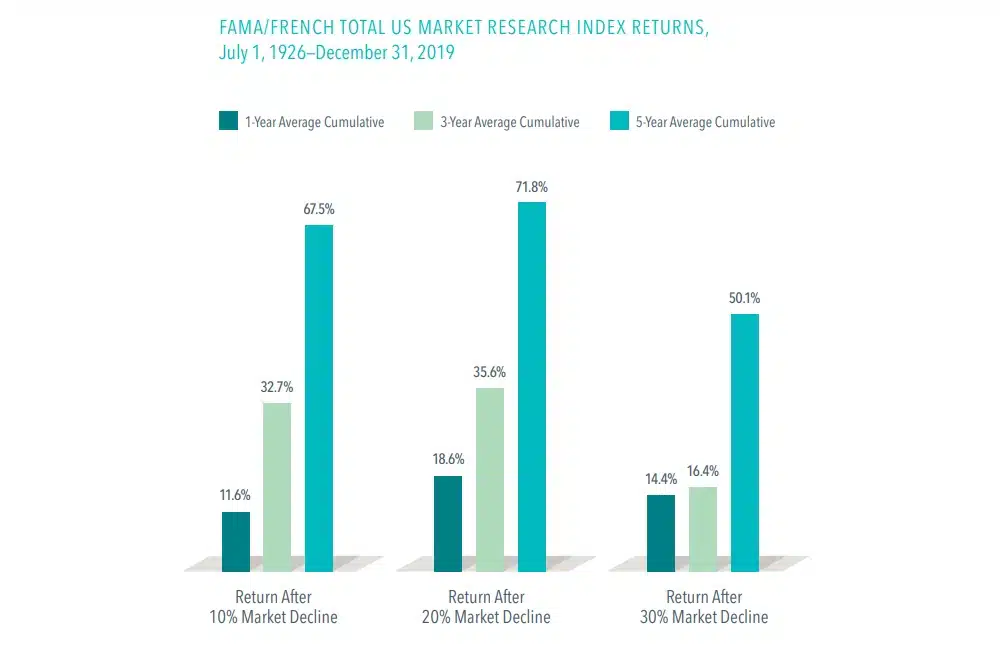
Sudden market downturns can be unsettling. But historically, US equity returns following sharp downturns have, on average, been positive.
Sticking with your plan helps put you in the best position to capture the recovery.

(1) The average annualized returns for the five-year period after 10% declines were 9.33%; after 20% declines, 9.66%; and after 30% declines, 7.18%.
This post was prepared and first distributed by Dimensional Fund Advisors.
Shore Point Advisors is registered as an investment adviser with the State of New Jersey. Shore Point Advisors only transacts business in states where it is properly registered, or is excluded or exempted from registration requirements. Past performance is not indicative of future returns. All investment strategies have the potential for profit or loss. There are no assurances that an investor’s portfolio will match or outperform any particular benchmark. Content was prepared by a third-party provider. All information is based on sources deemed reliable, but no warranty or guarantee is made as to its accuracy or completeness. All expressions of opinion reflect the judgment of the authors on the date of publication and are subject to change.

Discover an investing mindset every entrepreneur can use to build wealth, manage risk and grow with confidence.

Homeowners insurance rates are climbing fast. Learn what’s driving the surge and how it could impact you.

Explore how inflation-protected bonds compare to nominal bonds, and what investors should consider when hedging against inflation.

Throughout his career, Warren Buffett has shared some of the secrets to his success. Here are some of our favorite insights.