The yield curve is flattening!
Yield curve spreads are narrowing!
The yield curve has inverted!
Headline-grabbing yield curve commentary somehow sounds important, doesn’t it? But what is a yield curve and what does it have to do with you and your investments?
A Tour Around the Curve
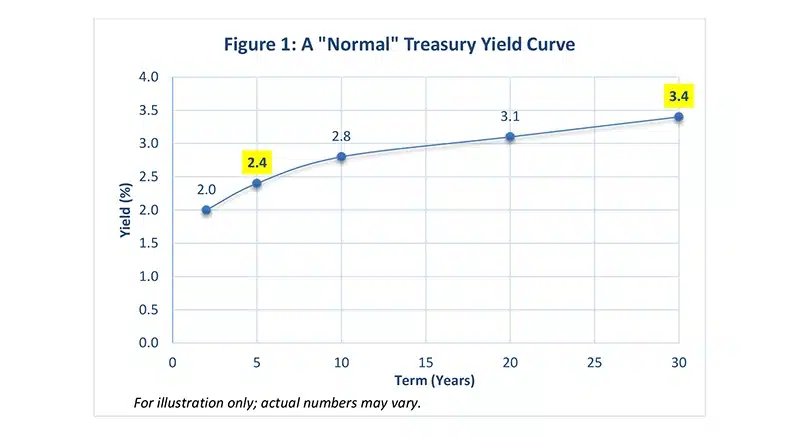
Yield curves typically depict the various yields across the range of maturities for US Treasury Bonds. For example, Figure 1 would inform us that a U.S. Treasury bond with a 5-year maturity was yielding 2.4% annually, while a 30-year Treasury bond was yielding 3.4%. Hence, the 5-30yr spread, the difference in yield between the two maturities, was 1.0%.
What’s “Normal”?
Let’s look at the curve itself – that is, the line that connects the data points just discussed.
The shape of the yield curve helps us see the relationship between various term/yield combinations available for any given bond class at any given point in time.
Just as our body temperature is optimal around 98.6°F (37°C), there’s a preferred equilibrium between bond market terms and yields. “Normal” occurs when short-term bonds are yielding less than their longer-term counterparts.
Under normal economic conditions, investors expect to be compensated with a term premium for taking the incremental risk of owning longer maturities. They’re accepting more uncertainty (and more price volatility) about how current rates will compare to future possibilities. Conversely, they’ll accept lower rates for shorter-term instruments, offering greater certainty.
At the same time, evidence suggests there’s often a law of diminishing returns at play. Typically, the further out you go on the yield curve, the less extra yield is available. Thus, Figure 1 depicts a relatively normal yield curve, with a bigger jump to higher yields early in the curve (a steeper spread) and a more gradual ascent (narrower spread) as you move outward in time.
Variations on the Curve
If Figure 1 depicts a normal yield curve, what happens when things aren’t so normal – such as with Quantitative Easing [i] or zero or negative rates overseas?
The shape of the yield curve essentially reflects evolving investor sentiments about unfolding economic conditions.
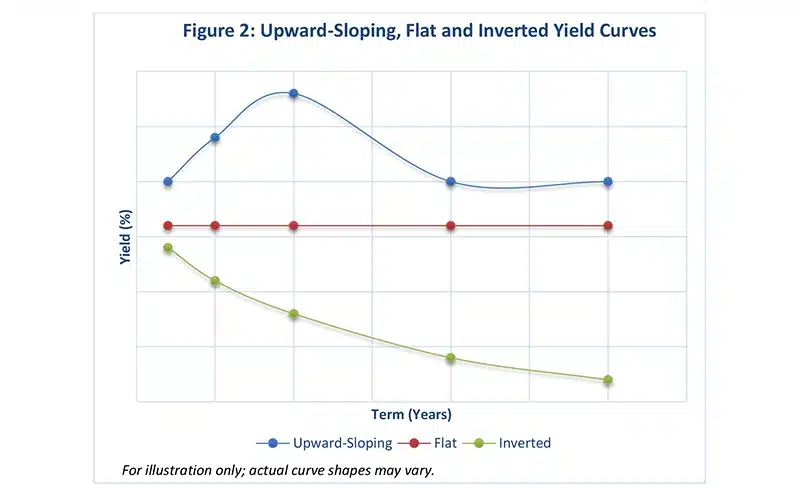
In short, expectations theory suggests that the yield curve reflects investor expectations of future interest rates at any given point in time. Thus, if investors in aggregate expect rates to rise (fall), the yield curve will slope upward (downward). If they expect rates to remain unchanged, it will be flat. Figure 2 depicts three different curve shapes that can exist.
You, the Yield Curve and Your Investments
It’s rare for the yield curve to invert, with long-term yields dropping lower than short-term. But it does happen. This typically is the result of the Federal Reserve (or another country’s central bank) tightening monetary policy, i.e., driving up short-term rates to restrict monetary conditions to fight inflation. An inverted yield curve is often followed by a recession – although not always, and not always universally.
Does this mean you should head for the hills if the yield curve inverts or takes on other “abnormal” shapes? Probably not. At least not in reaction to this single economic indicator.
As with any other data source, bond yield curves are best employed to inform and sustain your durable, evidence-based investment plans, rather than to tempt you into abandoning those plans every time bond rates make a move. Big picture, this typically means investing in bonds that offer the highest yield for the least amount of term, credit and call risk. (Call risk is realized if the bond issuer “calls” or pays off their bond before it matures, which usually forces the bond’s investors to accept lower rates if they want to remain invested in the bond market.)
The yield curve is an important tool for determining how to efficiently execute this greater goal. It helps explain why we typically recommend holding only high-quality bonds, minimizing call risk, and usually striking a balanced middle ground between short-term versus long-term bonds. Similar principles apply, whether investing directly in individual bonds or via bond funds and ETFs.
In short, it’s fine to consider the yield curve for an indication of near-term economic expectations, but it’s best to look past it to the distant horizon as you invest toward your steadfast financial goals.
We’re happy for you to be in touch if we can explain more about the current yield curve and the role bond investments and fixed income products play in a well-diversified portfolio.
![]()
Shore Point Advisors is registered as an investment adviser with the State of New Jersey. Shore Point Advisors only transacts business in states where it is properly registered, or is excluded or exempted from registration requirements. Past performance is not indicative of future results. All investment strategies have the potential for profit or loss. There are no assurances that an investor’s portfolio will match or outperform any particular benchmark. This content was prepared by a third-party provider. All information is based on sources deemed reliable, but no warranty or guarantee is made as to its accuracy or completeness. All expressions of opinion reflect the judgment of the authors on the date of publication and are subject to change.
[i] Investopedia defines Quantitative Easing (“QE”) as an unconventional monetary policy in which a central bank purchases government securities or other securities from the market in order to lower interest rates and increase the money supply. https://www.investopedia.com/terms/q/quantitative-easing.asp